Project ##
Project Descriptions
Project Information
Project Name
Traffic Count Survey Narayanganj City 2024
Client:
Maxwell Stamp Ltd.
Location:
Narayanganj City, EPZ Narayanganj
Funding/ Implementing Agency
Roads and Highway Department , Ministry of Road Transport and Bridges, Bangladesh
Date:
November, 2024
Website:
www.maxwellstampltd.com
Traffic Count Survey Narayanganj City 2024
Our team executed a thorough and multi-faceted approach to conduct the Vehicle Classified Traffic Count Survey and Live Population Counting Survey in Narayanganj City. This project, conducted at two strategic locations—Chashara Mor and EPZ Narayanganj—provided detailed insights into traffic flow and live population percentages for specific vehicle types. Below are the key activities and services we delivered:
Development of Field Survey Plan
A detailed field survey plan was designed to ensure efficient and thorough data collection. The plan identified survey objectives, selected key locations, and outlined a timeline to capture both weekday and weekend traffic patterns.
Pre-Field Visit and Assessment
A pre-field assessment was conducted to evaluate conditions at Chashara Mor and EPZ Narayanganj. This helped us identify site-specific challenges, fine-tune our data collection strategy, and ensure seamless execution during the main survey.
Recruitment and Training of Field Personnel
- Recruitment: A skilled team of enumerators and field personnel was recruited to manage traffic classification and live population counting tasks.
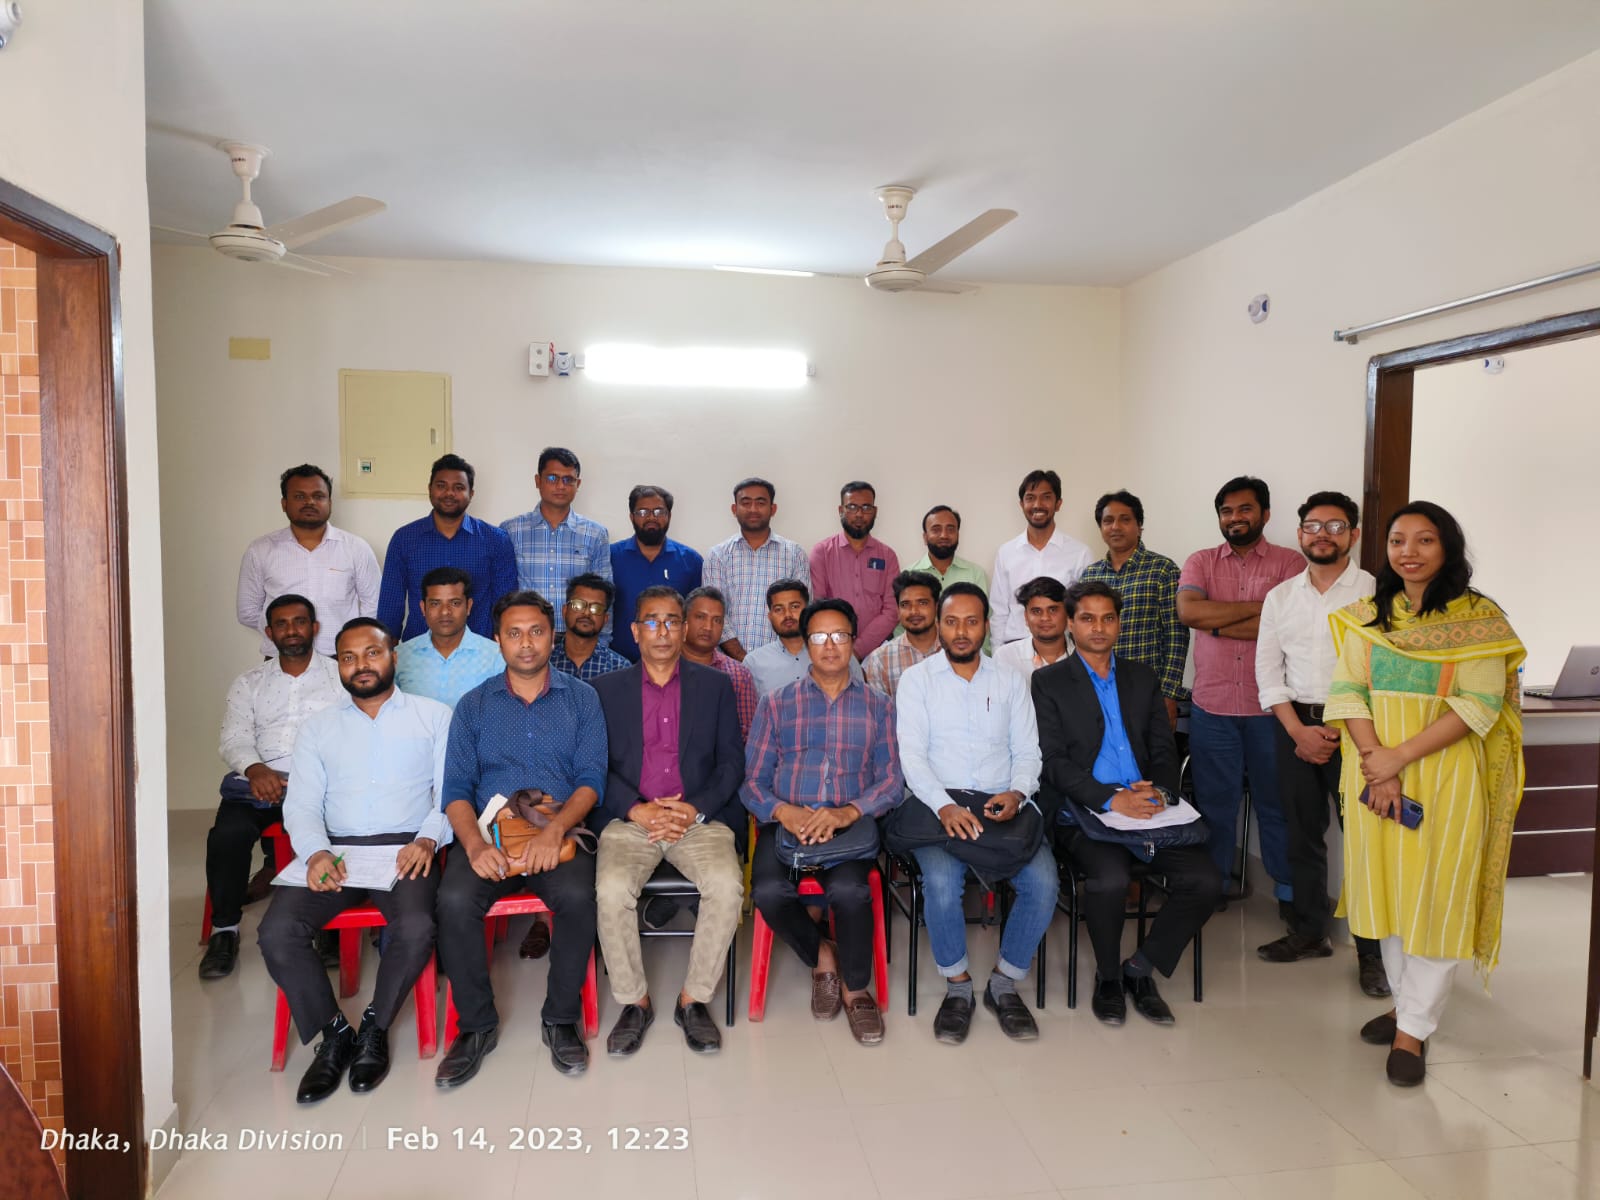
- Training: The team received rigorous training on video recording, vehicle classification, live population counting protocols, and troubleshooting on-site challenges.
48-Hour Continuous Video Recording at Two Locations
The traffic count survey covered 48 hours per location, split across two periods:
- Wednesday 6:00 AM to Thursday 6:00 AM (Weekday traffic).
- Friday 6:00 AM to Saturday 6:00 AM (Weekend traffic).
Each location’s survey included two directions, resulting in 96 hours of video data per location. Combined, this amounted to 192 hours of continuous video data, ensuring robust data capture across various traffic conditions.
Live Population Counting for Specific Vehicle Types
To complement the traffic data, enumerators conducted live population counting for the following vehicle types:
- Bus
- Large Bus
- Leguna
Timing: Enumerators stood roadside from 8:00 AM to 9:00 PM, observing and counting the number of passengers onboard each vehicle type.
Objective: This activity aimed to estimate the population percentage for these vehicles, providing critical data on public transport usage during peak hours.
5-Minute Interval Video Segmentation and Vehicle Classification
The 192 hours of video data were segmented into 5-minute intervals for meticulous analysis. Each segment was carefully reviewed to classify vehicles into 13 categories, ensuring a granular breakdown of traffic patterns.
Aggregation of Vehicle Counts
To identify trends, vehicle counts were aggregated at different intervals:
- 15-Minute Aggregation: Short-term trends.
- Hourly Aggregation: Broader trends and peak hours.
Data Cleaning and Quality Assurance
Data underwent rigorous cleaning and quality assurance to ensure accuracy and consistency. This included verifying vehicle classifications, cross-checking population counts, and refining data for analysis.
By combining traffic count data and live population observations, we delivered comprehensive insights into Narayanganj City’s traffic dynamics and public transport utilization. These findings equip our clients with precise and actionable data to inform decision-making and urban planning.
